Table of contents
Observability is not the microscope. It’s the clarity of the slide under the microscope.” — Baron Schwartz*
What is Observability?
A quick Google search says that the observability of a system refers to how well its internal states may be deduced from knowledge of its exterior outputs. It comes from the concept of control theory, which you can read about here.
In layman's terms, Observability means whether you understand what’s going on inside your code or system, simply by asking questions using your tools. Let’s draw an analogy to that of a Car’s dashboard, which contains observability features that enable you to understand how the vehicle is performing (speed, rpm, temperature, etc).
 source: skedler.com
Building systems with the presumption that someone will be watching them is fundamental to observability. Therefore, no matter how sophisticated your infrastructure may be, observability is the ability to respond to any query about your business or application, at any time. The simplest way to accomplish this in the context of application development and operations is by instrumenting systems and applications to gather metrics, traces, and logs, then passing all of this information to a system that can store and analyze it and provide insights.
A brief history of Observability
Electrical engineer, mathematician, and inventor Rudolf Emil Kálmán originally used the term “observability” to define a system’s ability to be measured by its outputs way back in the 1960s.
 source: academy.broadcom.com
Observability was a term that engineers in the industrial and aerospace industries used frequently, but it wasn’t until about 30 years later that it began to be used by IT professionals.
One of its earliest manifestations was in a blog post written by engineers at Twitter in 2013, where they discussed the “observability stack” they had developed to track the health and performance of the “diverse service topology”.
Their systems’ overall complexity and the way those systems interacted dramatically increased as a consequence. They referred to their observability solution as “a key driver for rapidly identifying the core cause of difficulties, as well as improving Twitter’s general dependability and efficiency.”
The 3 pillars of Observability
 source: dynatrace.com
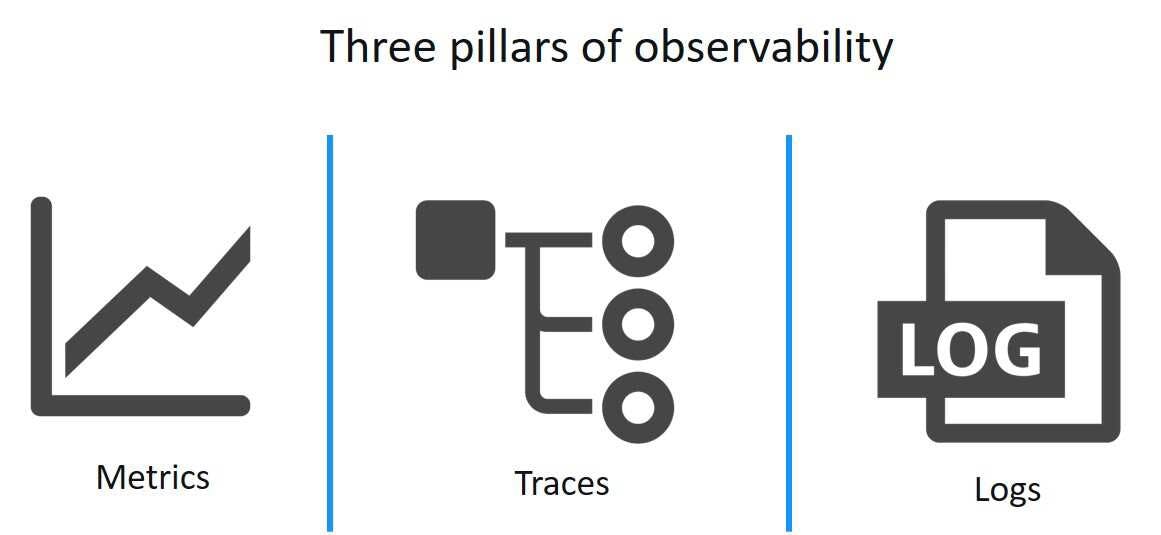
DevOps and SRE teams have a comprehensive understanding of distributed systems in cloud and microservices setups thanks to the three data inputs; metrics, logs, and traces. These three pillars, often known as the “Golden Triangle of Observability in Monitoring,” support the observability architecture, allowing IT staff to recognize and analyze failures and other system issues regardless of the location of the servers.
Metrics
Key performance indicators (KPIs) such as response time, peak load, requests served, CPU capacity, memory utilization, error rates, and latency are examples of observability metrics. Among these Google defines the four golden signals which are:
Latency: time taken to service a request Traffic: request/second Error: error rate of request Saturation: the fullness of a service
Traces
Traces allow DevOps admins to find the source of an alert. They take into account a chain of dispersed events as well as the interplay between them, which is why traces can pinpoint exactly where bottlenecks are occurring by tracking system dependencies in this way. To identify which step in a process is slow, the following traces can be used:
API Queries Server-to-Server Workload Internal API Calls Frontend API Traffic
Logs
Logs are immutable timestamped records of discrete events that happened over time. Simply said, Logs provide answers to the “who, what, where, when, and how” of access-related activities. Because microservers frequently use several data formats, log data must be organized, which makes aggregation and analysis more challenging.
Logs offer unparalleled levels of detail, but their volume makes them difficult to index and expensive to manage. Even when they do, logs from systems with a high number of microservices cannot demonstrate concurrency, which is a challenge for many enterprises.
Difference between monitoring and observability
 source: xenonstack.com
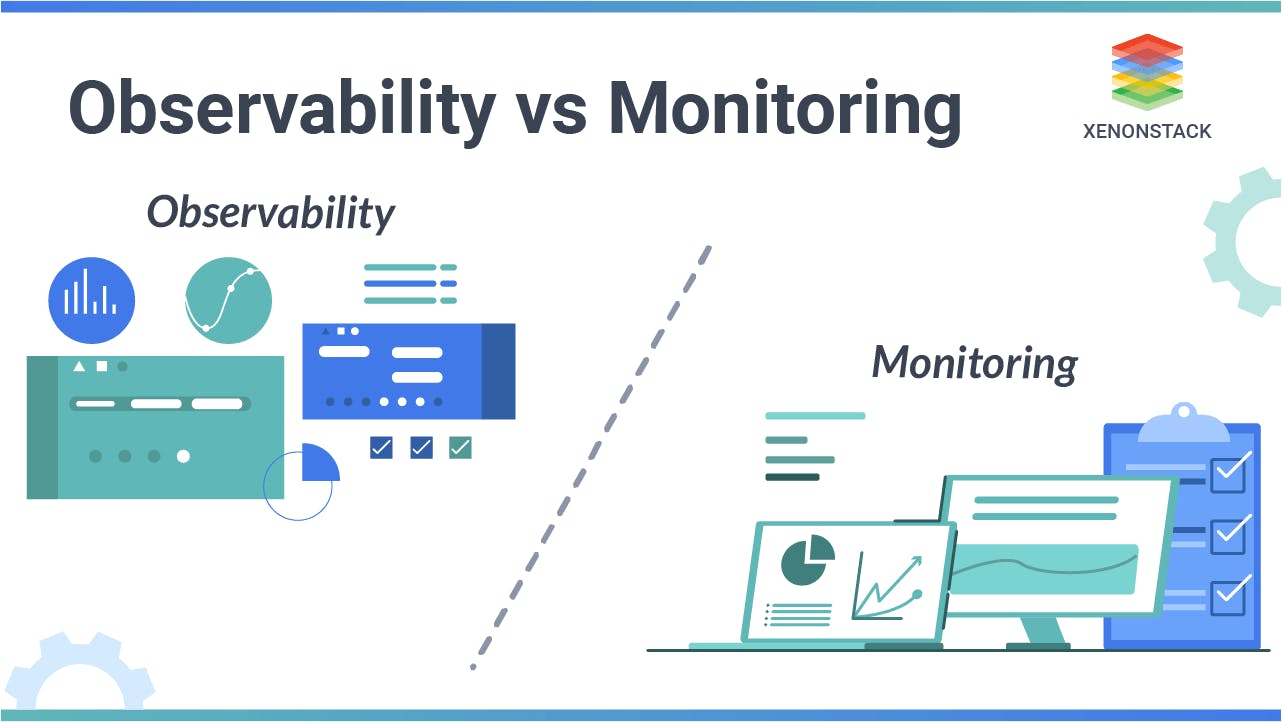
When addressing IT software development and operations (DevOps) strategies, observability and monitoring are frequently used interchangeably. Observability and monitoring are complementary, but distinct, capabilities that both play a significant part in assuring the security of systems, data, and security perimeters.
Typically, in a monitoring scenario, you preconfigure dashboards that are intended to notify you of performance concerns you anticipate seeing later. But, the fundamental premise behind these dashboards is that you can foresee the types of issues you’ll face before they arise.
Cloud-native platforms do not lend themselves well to this form of monitoring since they are dynamic and complicated, making it difficult to predict what kinds of problems may occur.
The key distinction between the two is that while observability infrastructure handles complex, frequently unexpected problems like those brought on by the interaction of complicated, cloud-native applications in distributed technology environments, monitoring tools identify performance problems or anomalies a DevOps team can foresee.
Try to picture it like this, the method used to gauge how effectively you can comprehend your complex system is called observability (a noun). On the other hand, an action you can perform to support that strategy is considered monitoring (a verb).
Examples of Observability
 source: bravenewgeek
Over the past ten years, the widespread adoption of cloud-native services, such as serverless, microservice, and container technologies, has burdened enterprises with massive, globally dispersed spiderwebs of interdependent systems. Traditional monitoring technologies are unable to track and monitor the sophisticated relationships between these systems to pinpoint outages and other issues, let alone diagnose and resolve them.
This job is carried out by Observability, which provides DevOps teams with visibility across intricate, multilayered systems so they can recognize the connections between different steps and rapidly find the root of an issue.
Stripe
Payment provider, Stripe uses distributed tracing to find the causes of failures and latency within networked services. Stripe has also created early fraud detection capabilities, which use ML models based on similar data to identify possible malicious activity. This is because its payments platform is a favored destination for payments fraud and cybercrime.
In order to monitor service health, alert on issues, support root cause investigation by providing distributed systems call traces, and support diagnosis by building a searchable index of aggregated application/system logs, the Observability Engineering team at Twitter offers full-stack libraries and a variety of services to the internal engineering team.
Facebook uses similar large-scale distributed tracing systems to Stripe. Facebook employs distributed tracing to gather comprehensive information about its online and mobile apps. Facebook’s Canopy system, which also has a built-in trace-processing engine, aggregates datasets.
Network Monitoring
Another example of observability in action is network monitoring, which is utilized to identify the root cause of performance issues that could otherwise have been incorrectly attributed to an application or other teams.
Network monitoring software may demonstrate that a certain issue arises at the ISP or third-party platform level by precisely recognizing network-related issues. Internal tensions are reduced as a result, and the issue at hand is quickly solved.
Best Practices for Implementing Observability
 source: blog.opsramp.com
With a huge chunk of industries shifting to microservices, cloud platforms, and container technology, it has become crucial for them to adopt and implement observability techniques into their structure.
The following is a comprehensive list of the best practices when implementing observability principles for your organization:
Put together an observability team: Establishing a committed observability team is the first stage in establishing observability. This team’s responsibility is to claim ownership of observability inside the business, consider the approach, and develop an observability strategy. The enterprise’s specific observability adoption targets should be listed in the plan and taken into consideration. The most significant use cases for observability across the enterprise should also be defined and documented.
Set important observability metrics: The most important observability statistics can be determined from an analysis of business priorities, and choices can be made on the metrics, traces, and logs of data from throughout the corporate technology stack that will be required to create those measurements.
Identify and record industry standards for governance, security, and data management: Data formats, data structures, and metadata must all be documented in order to assure compatibility across the many types of data that will be gathered. In large businesses with numerous teams, where there is a propensity to work in distinct silos, each with its own vocabulary, dashboards, and reports, this is imperative.
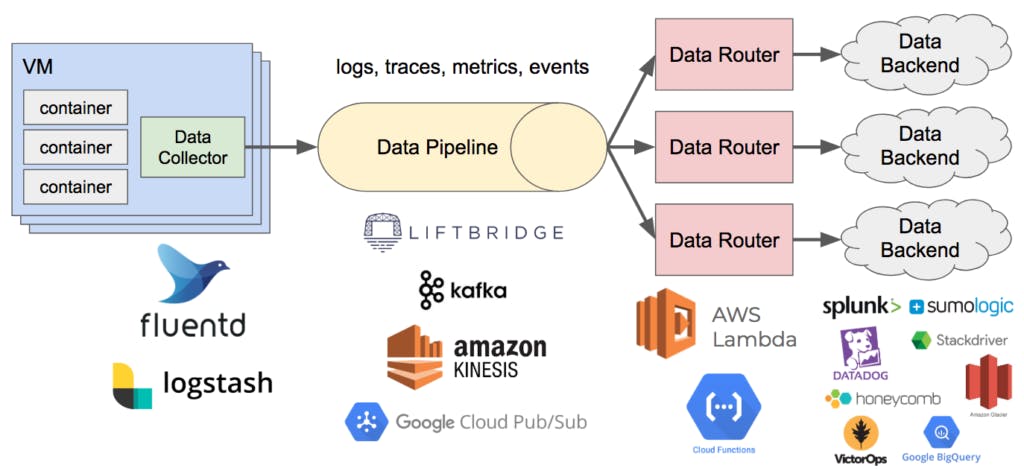
Centralize data sources and choose analytics tools: A documented observability framework promotes cross-divisional cooperation and sets the stage for the following actions, which include creating an observability pipeline and developing a centralized observability platform for data ingestion and routing to analytical tools or temporary storage.
Educate teams to empower proficiency: An observability framework’s essential building components are organized around education. Frequent boot camps for both current and new personnel will foster comprehension and engagement, enable positive and informed action, and assure the accomplishment of peak observability in addition to fostering an observability culture.
The Bottom Line: Embrace Observability
 source: broadcom.com
Observability is a crucial and practical method for determining the current condition of your network system. Systems are now more sophisticated than ever because of innovations like containerization, microservices, and the cloud.
Given that observability is a new technology. As distributed enterprise IT environments become more prevalent, observability will develop and advance, enabling more data sources, automating more tasks, and supporting organizational defenses against cybercrime, incapacitating outages, and violating privacy laws.
Throughout the whole software lifecycle, modern observability equips software engineers and developers with a data-driven approach. With the help of strong full-stack analysis tools, it unifies all telemetry — events, metrics, logs, and traces — into a single data platform, enabling users to plan, develop, deploy, and manage excellent software to offer excellent online experiences that spur innovation and progress.
